649 ETH, or $1.72 million, were placed into Vitalik Buterin’s Ethereum wallet over the previous day. The price of ETH is rejected.
According to the most recent on-chain statistics, Vitalik Buterin, a co-founder of Ethereum, has not stopped selling the altcoins that he owns with ETH. The price of ETH saw selling pressure after exhibiting significant growth this past week, with a further 2% correction in the last day.
Vitalik Buterin continues selling Ethereum
Ethereum co-founder Vitalik Buterin has moved close to 1,300 ETH to cryptocurrency exchange Paxos during the last 12 days, according to SpotonChain’s on-chain statistics. It also reveals that on the previous day, 649 ETH, or $1.72 million, were deposited to Paxos from Buterin’s wallet, which is known as “0x556.”
On September 19, this month, 1,300 ETH ($3.21 million) were sent to the same wallet from “0xd04,” a different address that Buterin had established with 70,000 ETH back in 2022. Wallet “0x556” has moved all 1,300 ETH to Paxos during the last 11 days, profiting from Ethereum’s recent price increase. $3.35 million was raised from the average sale price of $2,581 per Ethereum.
Wallet “0x556,” associated with @VitalikButerin, deposited the last 649 $ETH ($1.72M) to #Paxos ~20 hours ago.
Notably, on Sep 19, wallet “0x556” received 1,300 $ETH ($3.21M) from wallet “0xd04,” which got funded with 70K $ETH by Vitalik Buterin in 2022.
Over the past 11 days,… pic.twitter.com/tuRYZKGmiV
— Spot On Chain (@spotonchain) September 30, 2024
As a way to improve the Ethereum ecosystem, Vitalik Buterin introduced the idea of “Ethereum alignment,” which coincided with the most recent wallet changes. The goal of this new framework is to strike a balance between Ethereum’s ecosystem and decentralization. In addition, the “Ethereum Alignment” program prioritizes decentralization and supports initiatives that advance public benefits.
It aims to bring together developers, client teams, and academics in the pursuit of creating a unified, decentralized environment. Furthermore, Vitalik Buterin emphasized the significance of open-source concepts, which advance network security and transparency.
As the co-founder of Ethereum has been selling, astute whales have been purchasing the ETH declines. Eight hours ago, a shrewd Ethereum trader bought 10,083 ETH for $26.8 million, according to Lookonchain.
The trader has a perfect record; since August 12, he has made ten profitable swing trades using ETH, making $2.14 billion in profit. However, last week saw the return of spot Ethereum ETF inflows, indicating institutional engagement.
This smart trader with a 100% win rate in swing trading $ETH bought 10,083 $ETH($26.8M) again 8 hours ago!
Since August 12, he has traded $ETH 10 times, making money every time, with a total profit of ~$2.14M!https://t.co/a80xVafIlu pic.twitter.com/BY8aXlSHir
— Lookonchain (@lookonchain) September 30, 2024
ETH price faces resistance
The price of Ethereum (ETH) has dropped 1.34% in the last day, despite exhibiting strength throughout the previous week. It is presently trading at $2,626.78, with a $316 billion market capitalization. Prominent cryptocurrency researcher Daan Crypto declared, “ETH has not yet reached a higher high, something that BTC accomplished last week.” As a result, more work has to be done by the bulls to validate the trend reversal.
To validate an overall upward trend, the price of ETH must first break over its 200 EMA at $2,800 in order for this to occur.
$ETH Is yet to make a higher high. Something $BTC managed to do this week.
For this, ETH needs to break that ~$2.8K price level which also has the Daily 200EMA sitting at the same area.
Rough level to break, but an important one. Also for the overall altcoin momentum. pic.twitter.com/OqIxDh9h82
— Daan Crypto Trades (@DaanCrypto) September 29, 2024
Amidst the general market decline in Monday’s early trading hours, the price of ETH has corrected, indicating that the market is anticipating turbulence ahead of this week’s publication of US employment data.
FTX token surges 113% – What triggered the rise
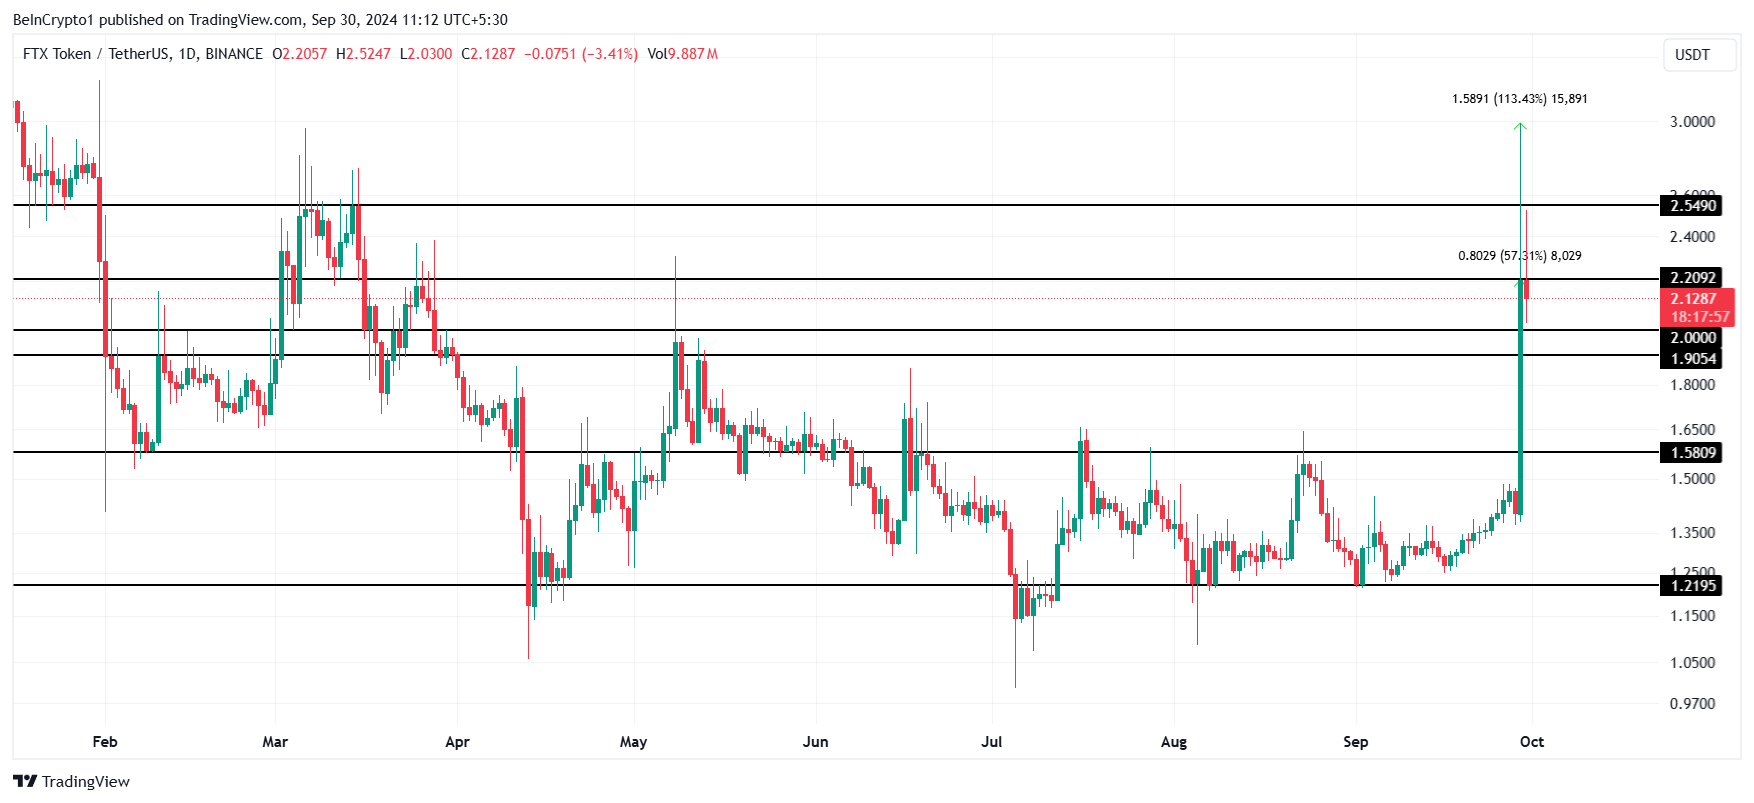
FTX Token (FTT) had a sharp increase in price, rising 113% at a Sunday intraday peak. This unexpected increase came after unfounded reports of a possible $16 billion debt payback to creditors.
FTT holders shifted their attention, with many getting ready to sell off their assets, as a result of the market’s euphoria. But by the end of the day, FTT’s price had reversed, finishing 57% higher than its initial value, leaving investors unsure of what would happen to it going forward.
FTX token goes up
FTX has strong roots in the cryptocurrency market, which explains the current spike in token values. A surge in optimism among investors was propelled by conjecture on the approaching repayment obligations. Many had predicted that on October 1, FTX would start paying its debtors back, perhaps reviving the market with $16 billion.
But Sunil, who represents the biggest group of FTX creditors, put an end to this untrue claim. He mentioned in a tweet that the repayment plan hearing is set on October 7.
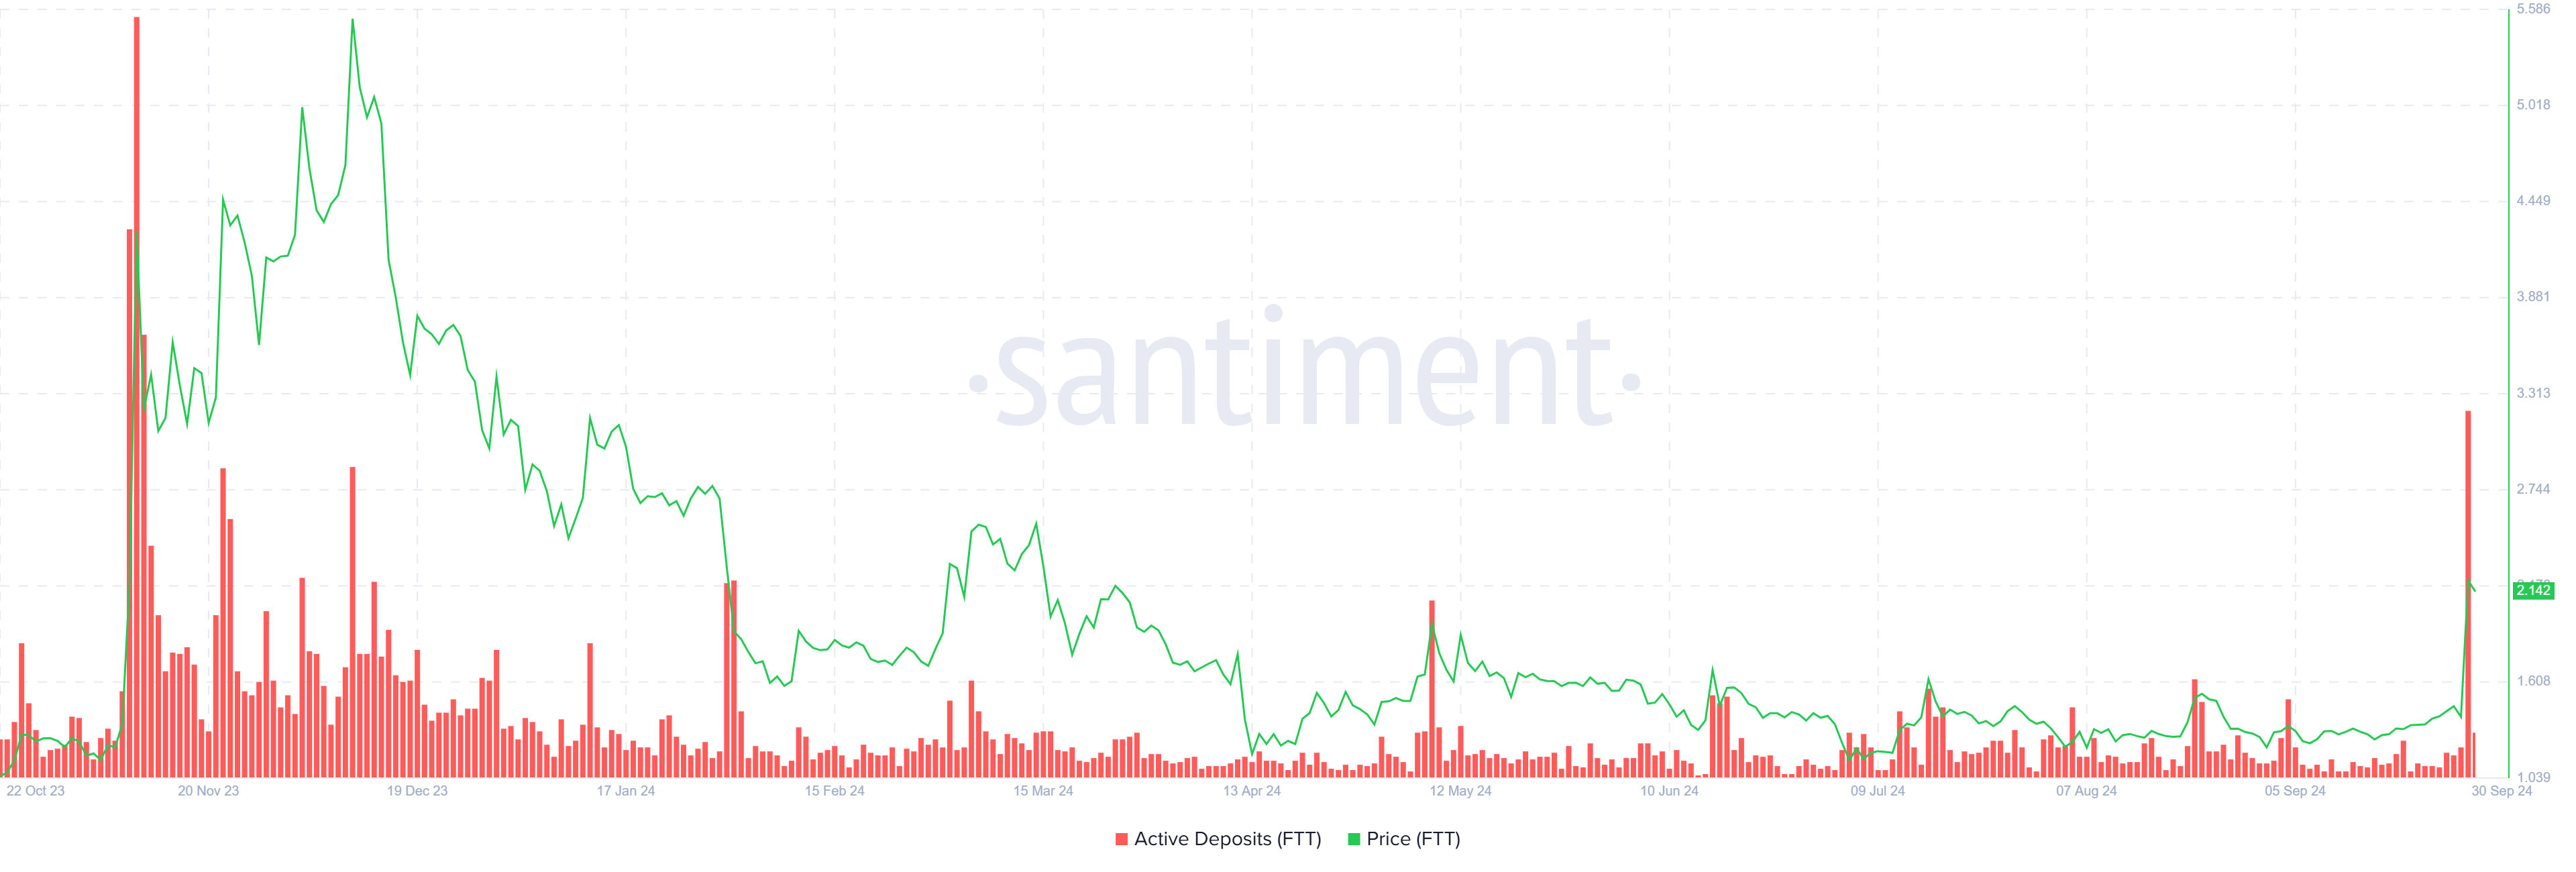
Nevertheless, active deposits have already reached a ten-month high due to the increase in the price of FTX Token. A potential repayment scheme sparked speculation, which boosted market activity. Deposit volumes spiked as investors started moving their stocks to exchanges in anticipation of a large $19 billion influx.

This action suggested that a lot of investors were keen to profit from the price increase. Even with all the enthusiasm, the higher deposits suggest that some traders are being cautious and planning to sell their shares when the time is right.
FTT price prediction: Errors to be fixed
FTX Token had a 113% price surge on Sunday before a correction and a final 57% increase in value. FTT is now trading at $2.12, which reflects the recent volatility and interest the coin has attracted.
When the market settles, FTT may find support at $2.00. If the market attitude stays favorable, a rebound from this level might propel the cryptocurrency back beyond the $2.20 threshold.

But with the hearing scheduled for next week, quick profit-taking at these prices might trigger a big decline. If FTT breaks below its $1.90 support level, it might fall much lower to $1.58, undermining the positive view that is now in place.
Why is today’s price of XRP higher?
Today’s price increase for XRP indicates that the altcoin’s market structure may support further growth.
XRP has done better than the overall cryptocurrency market, rising 1.5% over the last day to reach an intraday high of $0.6328. In contrast, the $2.3 trillion global cryptocurrency market capitalization has decreased by 0.3% throughout that time.
On September 29, XRP’s price surge was accompanied by strong trading activity, which has increased over the previous seven days. On September 28, XRP’s spot trade volumes exceeded $2.2 billion, a 133% increase from September 21.
Additionally, its market value has grown to $35.4 billion, solidifying its ranking as the world’s seventh-largest cryptocurrency.
In the end, following a few weeks of sideways price contraction, XRP seems poised for a long-term upturn.
Let’s examine the causes of the current increase in the price of XRP.
XRP outperforms Bitcoin
According to TradingView data, the price of XRP increased from an intraday low of $0.5857 on September 28 to a high of $0.6328 on September 29. As of the time of publishing, XRP is trading at an average price of $0.6285.
Over $1.9 million worth of long and short bets on XRP’s price movement have been settled in the last day, according to Coinglass statistics. 73% of the liquidated bets totaling $1.37 million are long positions.
The rise in XRP’s price coincides with a little decline in the value of Bitcoin (BTC). The biggest cryptocurrency by market capitalization has dropped below $66,000 to $65,700 in the previous day, a decrease of less than 0.1%.
Over longer periods, XRP has done better than Bitcoin, rising 31% over the past 90 days compared to BTC’s 5% gains. Because of this, for the past three months, XRP has trended upward relative to Bitcoin, gaining 25% between June 28 and September 29.
This demonstrates how the market structure of XRP is getting stronger, which might lead to price increase in the upcoming months.
Four-year symmetrical triangle suggests explosive XRP price growth
Another optimistic indicator on the monthly chart is a sizable symmetrical triangle, which, according to anonymous cryptocurrency expert Milkybull Crypto, is positioning XRP for a “explosive” price increase.
The $XRP breakout of the 4-year triangle will be explosive, to be honest.
Study the triangle price pattern and get back to me. https://t.co/y8LqvdwBz5
— Mikybull 🐂Crypto (@MikybullCrypto) September 29, 2024
This was a reaction to the XRP study on September 28th, which revealed that the price was moving within a four-year symmetrical triangle.
A more general bullish trend may be indicated if XRP breaks above the top trendline. By measuring the height of the triangle at its broadest point and adding it to the breakout level, one may approximate the expected upside.
After XRP’s upward breakout from its present level around $0.6153, Milkybull Crypto predicts significant gains to levels between $10 and $20.
“The amount of bearish sentiment around this asset makes it possible to pull such returns.”XRP/USD daily chart. Source: TradingView
At $0.5743, the 50-month EMA serves as a dynamic support as well. before continuing to rise over this mark, XRP has a better chance of hitting $1 before the end of 2024.
Futures traders, who stand to lose $16.76 million if the price moves back up to $0.65, are skeptical of a swift recovery. $17.75 million in long bets would be lost with a 10% more slide to $0.6.


